Customize SciSure to work your way
Your lab, your workflows, your way. SciSure gives you full control over how you connect your research tools, instruments, and databases. Create custom connections that fit exactly how your team works–now and in the future.
.avif)
Trusted by 550,000+ scientists, EHS, and LabOps worldwide in 55,000+ laboratories


 Customer story
"SciSure helps us save time by enabling us to share our protocols with colleagues easily. It also takes care of our sample management."

 Customer story
“Working with the SciSure team has been a collaborative and productive experience.”


Build a platform that works for you
Ready-to-use integrations
Instantly connect SciSure to 40+ prebuilt add-ons to streamline workflows without extra setup.
Related:

40+ integrations

Free and premium add-ons

Constantly growing library
.avif)
Custom integrations with our API & SDK
Build custom integrations with SciSure’s open API and SDK to connect lab instruments, automate reporting, and sync data.
Related:

Open API

Developer SDK

Full developer support
.avif)
Flexible & adaptable to your lab’s needs
Easily integrate new tools as your lab evolves without switching platforms or disrupting workflows.
Related:

Connect any research tool

Automate your workflows

Future-proof your setup
.avif)
Connect instantly with 40+ add-ons
Our Marketplace offers a range of integrations to streamline operations, data collection, and research workflows.

Astra Iris - AI Support Assistant
AI-powered support assistant built directly into SciSure Research.
DataChaperone - Analysis & AI Platform
Automated, audit-ready data analysis directly inside your ELN.
.png)
DYMO® LabelWriter™ 550 Series
Streamline your lab labeling workflow with precision and ease
.avif)
DMPTool.org
Streamline workflows and enhance collaboration by integrating and managing data management plans from DMPTool within SciSure
.avif)
Protocols.io
Bring trusted protocols directly into your ELN
.avif)
Nikon NIS-Elements
For seamless exchange of data and notes between Nikon NIS-Elements microscopy-based imaging platform and eLabNext
Empower your lab with custom integrations
SciSure’s API and SDK give labs complete flexibility to build integrations that fit their unique workflows.


.avif)
How labs are customizing SciSure to their needs
See how research teams are connecting their tools, automating workflows, and optimizing data flow with SciSure.


See SciSure in action
Every lab is different, and SciSure is built to adapt. Book a demo today to see how our Scientific Management Platform (SMP) can transform your team’s workflows, streamline compliance, and help your research move faster.
Frequently asked questions
Everything you need to know about the product and billing.
SciSure supports prebuilt add-ons from our Marketplace, direct API connections, and fully customizable integrations via our SDK.
No. Many integrations are plug-and-play. However, some integrations require a paid license.
Most add-ons are free, while some premium integrations require a subscription. Pricing details are available in the user interface Marketplace.
Yes! SciSure’s API allows you to connect lab instruments, automate data collection, and sync results with your workflows.
Visit our Developer Portal for API documentation, SDK downloads, and integration guides.
Can’t find the answer you’re looking for? Please chat to our friendly team.
Stay ahead in lab innovation
Across the scientific ecosystem, lab sustainability has entered a new era. What was once treated as a reporting obligation has become a redesign challenge touching every part of the scientific value chain – from how labs operate and purchase equipment to how organizations plan, invest, and measure long-term impact.
Industry leaders increasingly see sustainability as a core business issue: shaping strategic priorities, influencing operational decisions, guiding capital allocation, and strengthening organizational resilience. The environmental agenda no longer competes with commercial performance – the two are fast becoming inseparable. Strong sustainability capability reduces risk, protects supply continuity, improves asset utilization, and prepares organizations for rapidly evolving expectations from regulators, investors, and health systems.
Despite this shift, lab sustainability remains one of the hardest areas to address. Labs are energy-intensive, process-heavy, and behaviorally complex environments. Real progress requires alignment between standards, equipment intelligence, and daily operational practice – not isolated initiatives or symbolic gestures.
At SciSure, we believe the only way to achieve meaningful, measurable improvement in lab sustainability is through collaboration. No single organization can solve the sustainability challenge in isolation. Standards must guide behaviors; data must reveal what’s actually happening inside equipment; and digital workflows must translate both into everyday action.
That’s why SciSure chose a collaborative approach to its sustainability mission; forging partnerships with organizations that are leading the way in their respective sustainability domains:
- My Green Lab, the global authority defining what sustainable laboratory practice looks like.
- Elemental Machines, the equipment intelligence platform that makes sustainability measurable and actionable.
- Polycarbin, the circular economy platform helping labs reduce waste and adopt more sustainable consumables.
To shine a light on these exciting partnerships and what they mean for SciSure customers, we spoke with James Connelly, CEO of My Green Lab, Kevin Ghiasi, VP of Global Alliances at Elemental Machines, and James O’Brien, Co-founder and CEO of Polycarbin. Their insights reveal how standards, equipment intelligence, and digital lab workflows combine to help SciSure Scientific Management Platform (SMP) users move from ambition to truly sustainable operations.
My Green Lab: Building the culture and standards behind lab sustainability
Improving lab sustainability can feel like a daunting challenge, particularly in environments built for precision, safety, and scientific performance. From energy-intensive equipment to complex waste streams, labs have historically been among the most resource-intensive environments around. Yet many of the most effective sustainability improvements are surprisingly practical, rooted in better habits, clearer standards, and consistent measurement.
This is the space where My Green Lab has become a global leader. Through its widely adopted certification programs, educational initiatives, and sustainability frameworks, the organization has helped thousands of laboratories embed sustainability into their daily operations. Today, My Green Lab Certification is widely recognized as a leading standard for sustainable laboratory practice, adopted by many of the largest pharmaceutical and biotechnology organizations.
For James Connelly, CEO of My Green Lab, the biggest barrier to improving lab sustainability is not a lack of awareness. Scientists increasingly understand the environmental impact of laboratory operations. The real challenge lies in translating that awareness into consistent daily habits across complex research environments.
“A lot of sustainability ultimately comes down to behavior change. You have to build a culture where everyone is thinking about sustainability as part of how they do their work every day. Many of the improvements are actually very straightforward: things like closing fume hood sashes, turning off equipment when it’s not in use, or consolidating autoclave and washer loads. But those small actions, when adopted consistently across an organization, can drive very significant environmental and energy savings.”
These practical adjustments may appear incremental in isolation, but across large research institutions they compound into meaningful improvements in sustainability. Equipment usage, freezer management, waste segregation, and procurement choices all influence the environmental footprint of laboratory work.
While behavior change is essential, James emphasized that lasting progress requires structure and accountability. Without consistent frameworks and credible measurement, sustainability initiatives risk becoming fragmented – or worse, performative.
“It’s important that sustainability programs are meaningful and verifiable. Certification needs to be measurable, independently audited, and repeatable across laboratories. Otherwise, it risks becoming a checkbox exercise rather than something that actually changes how labs operate.”
This emphasis on verification has shaped the My Green Lab Certification program, which pairs education and behavioral guidance with independent auditing to ensure laboratories are implementing recognized best practices. The framework also includes tools that help organizations estimate environmental and financial benefits from sustainability improvements, reinforcing the connection between responsible laboratory operations and long-term organizational performance.
“One of the challenges the industry faces is that many sustainability claims are difficult to compare or verify. Standards and third-party certification create a level playing field, so organizations can make informed decisions and ensure that sustainability improvements are real and measurable.”
Beyond operational practices inside the lab, My Green Lab has also expanded its influence across the broader research ecosystem. Programs such as the ACT EcoLabel introduce standardized environmental impact labels for laboratory products, allowing procurement teams to compare equipment and consumables based on verified sustainability metrics. As life science organizations increasingly extend sustainability expectations to suppliers and research partners to address scope 3 emissions, these standards are becoming an important part of how organizations approach lab sustainability across the value chain.
Embedding sustainability standards directly into the digital lab
For SciSure, partnering with My Green Lab reflects a strategic choice. Rather than attempting to replicate sustainability frameworks that have been developed and refined over many years, SciSure chose to collaborate with the organization already helping define global best practices for lab sustainability. The goal is not to reinvent sustainability standards, but to make them easier for laboratories to adopt by embedding them directly into the digital systems scientists already use.
From My Green Lab’s perspective, SciSure also represented a natural partner for advancing sustainable lab practices. Because the platform is already embedded across leading research institutions worldwide, it provides a direct connection to the environments where impactful sustainability decisions are made every day.
In practice, this partnership connects My Green Lab’s educational resources and sustainability frameworks with the digital workflows that manage safety, inventory, and compliance inside the SciSure SMP. This allows sustainability guidance to appear alongside the operational tasks scientists already complete, from training and chemical management to equipment oversight and compliance documentation.
By aligning sustainability practices with everyday operational processes, the collaboration helps lab teams move beyond standalone initiatives and integrate lab sustainability directly into their routine lab activity.
“Partnerships allow sustainability programs to reach scientists where they’re already working. If you can integrate sustainability education and guidance into the digital tools labs already rely on for safety, compliance, and operations, it becomes much easier for people to adopt meaningful practices while still ensuring that the results are measurable and verifiable.”
Looking ahead, the collaboration will continue to deepen as SciSure works to bring My Green Lab training programs and sustainability guidance directly into its platform environment. This will allow laboratory teams to access sustainability education alongside other required safety and compliance training, creating a more seamless pathway from awareness to action.
“The most important thing labs can do is start. There are practical steps that any lab can implement today, and when those actions are supported by the right standards and tools, they can deliver meaningful improvements in sustainability.”
By aligning globally recognized sustainability standards with digital lab workflows, the partnership helps SciSure customers take a more structured approach to lab sustainability—connecting education, behavior, and operational oversight within the systems scientists already rely on every day.
Elemental Machines: Turning lab sustainability into measurable operational intelligence
While My Green Lab helps define scientific sustainability standards, achieving meaningful progress also requires visibility into how laboratory environments and equipment actually perform. Sustainability frameworks establish best practices and guide behavior across the lab, but turning those principles into measurable operational improvements depends on understanding how equipment, infrastructure, and environmental conditions behave in real lab environments.
This is where Elemental Machines plays a critical role. Through connected sensors, environmental monitoring, and advanced analytics, the platform provides laboratories with continuous insight into how equipment, infrastructure, and environmental conditions behave in real time.
For Kevin Ghiasi, VP of Global Alliances at Elemental Machines, improving lab sustainability begins with establishing a reliable baseline of operational data.
“We see ourselves as the data foundation that makes sustainability measurable and actionable. Many labs want to improve sustainability, but they lack consistent visibility into equipment behavior, environmental stability, utilization patterns, and asset criticality. Without that baseline, improvement is difficult to quantify.”
In many labs, equipment such as ultra-low temperature freezers, incubators, and environmental chambers operate continuously with little insight into how often they are actually used or how efficiently they are running. Over time, this lack of visibility can lead to redundancies, unnecessary energy consumption, and equipment lifecycles that are shorter than they need to be.
By capturing environmental and equipment data through connected sensors and combining that information with structured analytics, Elemental Machines helps organizations identify inefficiencies that would otherwise remain hidden. This includes monitoring temperature stability, tracking equipment utilization, and evaluating the operational criticality of assets across the lab.
“Sustainability often follows operational discipline. When labs have structured data about how equipment is being used and how critical it is to operations, they can make more informed decisions about energy use, asset management, and resource allocation.”
One of the most significant shifts enabled by this type of monitoring is the move from reactive to proactive lab management. Rather than discovering inefficiencies after the fact, laboratories can identify opportunities to optimize operations as they occur.
“Sensor-driven monitoring allows labs to move from reactive operations to proactive operations. When you combine environmental monitoring with utilization data and criticality scoring, you can identify equipment that doesn’t need to run continuously, consolidate workloads onto fewer assets, and safely power down low-criticality devices during idle periods.”
These adjustments can have a substantial decarbonization impact, particularly in energy-intensive research environments. Underutilized or redundant equipment can significantly increase both energy consumption and operational costs. By revealing usage patterns and asset importance, laboratories can make informed decisions about consolidating equipment, retiring aging assets, or adjusting operating schedules without compromising scientific productivity.
Beyond energy savings, this level of operational insight also helps laboratories protect the integrity of their scientific work. Environmental stability monitoring can alert teams to temperature fluctuations or equipment performance issues that could compromise sensitive samples or experimental results.
Integrating equipment intelligence into the digital lab
For SciSure, the partnership with Elemental Machines adds a critical measurement and detection layer to the broader sustainability ecosystem being built across the platform.
Through integration between the two platforms, environmental monitoring and equipment intelligence from Elemental Machines can be connected directly to the operational systems scientists use to manage their work inside SciSure. This empowers labs to see how equipment conditions and performance relate to the samples, materials, and workflows managed within the digital lab environment.
Instead of sustainability metrics being reviewed separately from day-to-day research activity, environmental data becomes part of the same operational context as everyday research activities.
“Integration allows operational data to inform systems of record. When environmental intelligence and equipment utilization insights are embedded directly into workflow systems like SciSure, organizations can align procurement decisions, maintenance strategies, and equipment lifecycle management with real operational data.”
This kind of integration transforms sustainability from a retrospective reporting exercise into an ongoing operational discipline. Laboratories can monitor equipment performance continuously, identify inefficiencies early, and adjust practices in ways that improve both environmental outcomes and research efficiency.
Looking ahead, Kevin expects sustainability efforts across the life sciences industry to become increasingly data-driven, transparent, and integrated into broader operational decision-making.
“Over the next few years, sustainability will become more tightly connected to operational KPIs, governance, and risk management. Organizations will need objective, defensible metrics that demonstrate progress over time, and connected equipment data will play a foundational role in making that possible.”
For SciSure customers, the integration with Elemental Machines represents an important step toward making lab sustainability both measurable and operationally actionable. Instead of reviewing sustainability metrics in isolation, teams can see how equipment conditions, utilization patterns, and environmental stability intersect with the samples, materials, and workflows managed within the SciSure SMP.
This visibility empowers labs to identify inefficiencies earlier, optimize energy-intensive equipment, and make more informed decisions about asset utilization and infrastructure planning. By embedding equipment intelligence directly into the operational systems scientists already rely on, the partnership helps transform sustainability from a reporting exercise into a continuous operational discipline.
Polycarbin: Extending sustainability into lab materials and circularity
While standards and equipment intelligence are essential to improving lab sustainability, a significant portion of a laboratory’s environmental footprint lies in the materials it consumes and the waste it generates. Single-use plastics, packaging, and procurement decisions all contribute to Scope 3 emissions, making sustainable sourcing and waste reduction a critical part of the sustainability equation.
Historically, laboratory waste has been treated as an unavoidable byproduct of scientific progress, with large volumes of materials classified as hazardous and sent for incineration or landfill, even when they pose no such risk.
For James O’Brien, Co-founder and CEO at Polycarbin, addressing this blind spot is central to enabling more sustainable science:
“There’s long been this assumption in labs that everything is hazardous and nothing can be recovered. In reality, a significant portion of that material is non-infectious, non-hazardous, and perfectly capable of being diverted into closed-loop recycling streams.”
This misconception has helped sustain a fundamentally inefficient, linear model of consumption. Laboratory plastics are typically produced from fossil fuel-derived virgin resins, used once, and then discarded, creating both environmental impact and supply chain volatility.
Polycarbin’s mission is to replace this linear model with a circular one; recovering laboratory plastics and returning them to the supply chain as high-quality, lab-grade materials.
Through its closed-loop recycling platform, Polycarbin enables laboratories to divert a broad range of waste materials such as rigid plastics, pipette tip boxes, and PPE into dedicated recycling streams, where they are processed and remanufactured into new lab-grade products.
“We’re producing materials that are DNase-free, RNase-free, pyrogen-free, and tested to USP Class VI standards. There are absolutely applications where recycled materials can meet the performance and compliance expectations of modern labs.”
By maintaining these stringent quality standards, Polycarbin directly challenges one of the most persistent barriers to adoption: the assumption that circularity requires a compromise in scientific rigor.
For Polycarbin, circularity is only part of the solution. Ensuring that sustainability efforts are credible, measurable, and actionable is equally important. This is where the company’s Carbin Counter™ platform plays a central role, providing labs with real-time insight into the environmental impact of their recycling activities.
“One of the things we’re most proud of is Carbin Counter, our platform that tracks and quantifies the environmental impact of a lab’s recycling activity in real time. Labs can see exactly how much plastic waste has been diverted from landfill, what their carbon savings look like, and how they’re trending against their own sustainability goals.
That visibility changes behavior — it turns recycling from a passive act into something teams can rally around and improve over time. It creates a culture where sustainability is a metric people actually care about, not just a value statement on a website.”
Built on ISO-compliant, third-party verified life cycle analysis, the platform enables organizations to connect everyday lab activity with defensible sustainability metrics—supporting ESG reporting, regulatory compliance, procurement decisions, and Scope 3 emissions tracking.
Making circularity operational in the digital lab
While visibility and circular systems are essential, implementing these approaches in real-world lab environments requires alignment with existing workflows, safety requirements, and regulatory constraints.
This is where Polycarbin’s partnership with SciSure becomes critical.
By integrating with SciSure, Polycarbin can align its recycling programs with the workflows, safety classifications, and compliance requirements already defined within the digital lab environment. This provides a clearer, more structured view of laboratory operations, helping teams identify which materials can be safely diverted, ensure appropriate training, and scale sustainability initiatives with confidence.
“In labs that use SciSure, there’s a much clearer picture of what’s happening across workflows. That makes it significantly easier to introduce sustainable practices in a compliant, scalable way.”
More broadly, the partnership reflects a shift toward sustainability as an operational capability, rather than a standalone initiative.
“Sustainability becomes much easier to address when you have a well-run, well-organized lab. Platforms like SciSure provide that coordination layer, making it easier to adopt solutions like ours and embed them into everyday operations.”
By extending sustainability into materials, procurement, and waste workflows, Polycarbin addresses a critical but often overlooked part of the lab sustainability challenge. In combination with the standards provided by My Green Lab and the operational intelligence delivered by Elemental Machines, this creates a more complete picture of what sustainable science requires: connecting how labs operate, what they measure, and what they consume into a truly circular, data-driven system.
Bringing standards, data, and workflows together for more sustainable science
Improving lab sustainability is not a challenge any single organization can solve alone. Labs operate within complex ecosystems of technologies, suppliers, infrastructure, and scientific workflows. Meaningful progress requires collaboration across that ecosystem – bringing together the standards that guide behavior, the data that reveals operational realities, the materials and procurement decisions that shape environmental impact, and the systems that turn all of these into consistent daily practice.
As Jon Zibell, VP of Partnerships at SciSure, explains, advancing lab sustainability depends on connecting these elements through strong, purpose-built partnerships.
“Sustainability in the lab isn’t driven by any single solution, it requires a connected ecosystem of trusted partners working together to deliver real value to shared customers. At SciSure, we’re focused on breaking down data silos between applications, reducing administrative burden, and creating a more seamless, intuitive user experience through integrated technologies. We’re always looking to partner with leading organizations like My Green Lab, Elemental Machines, and Polycarbin to expand that ecosystem and accelerate impact across the industry.”
SciSure’s sustainability partnerships reflect this philosophy. My Green Lab provides globally recognized frameworks, education, and certification standards that help laboratories establish credible sustainability practices. Elemental Machines contributes the operational intelligence needed to understand how equipment, infrastructure, and environmental conditions behave in real time. Polycarbin extends this ecosystem into materials and circularity, enabling labs to reduce waste, adopt more sustainable consumables, and embed closed-loop practices into their operations.
Together, these capabilities provide both the standards, data, and material systems required to improve sustainability in scientific research environments. But translating those insights into everyday practice requires another critical element: operational integration.
Through the SMP, SciSure connects sustainability frameworks, equipment intelligence, circular material flows, and laboratory workflows within a single digital environment. Scientists can access training, manage safety and compliance processes, monitor equipment conditions, make more informed procurement decisions, and track environmental performance through the same systems that govern their daily lab operations.
As sustainability expectations across the science industry continue to grow, collaboration will only become more important. By bringing together partners like My Green Lab, Elemental Machines, and Polycarbin, SciSure is delivering on its mission to make safer, smarter, and more sustainable labs achievable—helping research organizations move toward a more tangible, coordinated, data-driven approach to lab sustainability.
Because solving the sustainability challenge will not come from any single tool or organization, but from ecosystems working together to drive meaningful change.
Ready to make your lab’s sustainability efforts more measurable and actionable? We’re here to help. Contact our team to discuss how SciSure can support your sustainable future.

Lab Sustainability That Moves the Needle: Inside SciSure’s Partnerships with My Green Lab, Elemental Machines, and Polycarbin
Discover how SciSure and its partners make lab sustainability achievable, embedding measurable, actionable practices into everyday lab operations.
Introduction
A Safety Data Sheet (SDS) is a standardized 16-section document that provides comprehensive information about a chemical substance or mixture, including its hazards, safe handling and storage procedures, exposure controls, emergency response measures, and regulatory status. Required under OSHA's Hazard Communication Standard (29 CFR 1910.1200) and structured according to the United Nations' Globally Harmonized System of Classification and Labeling of Chemicals (GHS), Safety Data Sheets are the primary way chemical manufacturers, importers, and employers communicate hazard information to workers.
For research laboratories, manufacturing facilities, and scientific organizations, SDS documents are far more than a regulatory checkbox. They are the foundation of a chemical safety program that protects people, ensures compliance, and supports informed decision-making at every level, from the bench scientist handling reagents to the EHS director preparing for an audit.
This guide covers what Safety Data Sheets contain, how the GHS framework standardizes chemical hazard communication worldwide, what OSHA's 2024 HCS update means for your organization's compliance timeline, and how to build a sustainable SDS management process.
What is the Globally Harmonized System (GHS) and why does it matter for SDS?
The Globally Harmonized System of Classification and Labeling of Chemicals (GHS) is a United Nations-led international framework that standardizes how chemical hazards are classified and communicated. Before GHS, a single chemical could be classified differently depending on the country, requiring separate labels, separate Safety Data Sheets, and separate training materials for each regulatory jurisdiction.
GHS solves this by establishing consistent criteria for evaluating chemical hazards, resulting in standardized labels (including signal words, hazard statements, and pictograms) and a uniform 16-section SDS format that is recognized internationally.
The GHS framework is maintained by a UN Sub-Committee that regularly revises the guidance to reflect current scientific understanding and best practices. The most recent significant revision, GHS Revision 7, forms the basis of OSHA's 2024 update to the Hazard Communication Standard.
For organizations operating across multiple countries or regulatory environments, GHS alignment simplifies compliance by providing a single classification framework. A chemical classified and documented under GHS in the EU follows the same structure as one documented in the United States or Canada, reducing duplication and the risk of inconsistent hazard communication across sites.
Key benefits of GHS standardization:
- Consistent hazard classification criteria regardless of country
- Standardized SDS format (16 sections) used worldwide
- Universal pictograms and signal words that communicate risk visually
- Simplified cross-border trade and regulatory compliance for multi-site organizations
What are the 16 sections of a Safety Data Sheet?

Every compliant SDS follows a mandatory 16-section format. OSHA requires Sections 1 through 8 to contain information most critical for immediate safety decisions, while Sections 9 through 16 provide technical, environmental, and regulatory detail.
OSHA's 2024 Hazard Communication Standard update: what changed for SDS
In May 2024, OSHA finalized a major update to the Hazard Communication Standard (HCS) to align U.S. requirements with GHS Revision 7. This is the most significant change to the HCS since the 2012 update that first adopted the GHS framework, and it directly affects how Safety Data Sheets are prepared, maintained, and communicated in the workplace.
The revised standard introduces new hazard classes, updates classification criteria, refines labeling requirements (including provisions for small containers), and adds specificity to SDS content requirements. OSHA expects these changes to reduce chemical-related workplace injuries and illnesses by improving the quality and clarity of hazard information available to employees.
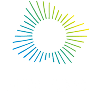
Key compliance deadlines (updated January 2026):
OSHA extended the original compliance dates by four months in January 2026 to give organizations additional time to implement the changes. The current deadlines are:
- May 19, 2026: Chemical manufacturers, importers, and distributors must update SDS documents and labels for pure substances to align with the revised HCS.
- November 20, 2026: Employers must update workplace labeling, employee training programs, and written hazard communication programs for substances.
- November 19, 2027: Manufacturers and importers must update SDS and labels for chemical mixtures.
- May 19, 2028: Employers must complete all remaining updates for mixtures.
During the transition period, organizations may comply with the 2012 HCS, the revised 2024 HCS, or a combination of both. However, mixed compliance requires careful coordination to ensure that labels, SDS documents, and training materials remain consistent.
For research institutions and multi-site organizations, these deadlines mean that SDS management processes, chemical inventory systems, and employee training programs all need to be reviewed and updated within the next 12 to 24 months. Organizations that rely on manual tracking methods, paper binders, or disconnected spreadsheets face a significantly higher risk of falling behind.
For organizations preparing for these compliance deadlines, building a structured approach to chemical inventory and SDS management becomes critical. This includes how chemicals are tracked, how SDS documents are maintained, and how updates are reflected across sites and teams.
Our webinar on building a scalable chemical inventory program walks through how to structure intake, reconciliation, and compliance reporting workflows that help keep SDS records consistent and up to date as requirements evolve:

Who needs Safety Data Sheets and when are they required?
Under OSHA's Hazard Communication Standard, SDS requirements apply across the chemical supply chain:
Chemical manufacturers and importers must prepare an SDS for every hazardous chemical they produce or bring into the country and provide it to downstream customers with the first shipment.
Distributors must ensure the correct, current SDS accompanies every shipment of hazardous chemicals to downstream buyers.
Employers must obtain and maintain a current SDS for every hazardous chemical present in the workplace. These must be readily accessible to employees during every work shift, not stored in a locked cabinet or buried in a shared drive folder that nobody can find during an emergency.
This requirement applies broadly. It covers research laboratories, manufacturing facilities, hospitals, agricultural operations, maintenance shops, and any workplace where employees handle chemicals beyond typical consumer use. OSHA citations for Hazard Communication violations are consistently among the agency's most frequently issued, and penalties for serious violations can reach $16,550 per instance.
For scientific organizations managing hundreds or thousands of chemical containers across multiple labs, buildings, or campuses, maintaining current SDS documentation is a significant operational challenge that manual processes alone cannot reliably support.
How to manage Safety Data Sheets effectively across your organization
Having SDS documents on file is only part of the requirement. The real compliance challenge is ensuring they are current, accessible, and connected to your chemical inventory. Here is what an effective SDS management process looks like in practice.
The difference between paper-based and digital SDS management isn't just convenience. It affects compliance readiness, emergency response time, and whether your team can actually find the right information when it matters.
- Keep SDS documents linked to your chemical inventory. An SDS is only useful when it can be quickly located for the specific chemical in question. The most reliable approach is an electronic system that automatically links SDS records to individual chemical containers, searchable by chemical name, CAS number, or manufacturer. This eliminates the common problem of having an SDS binder that doesn't match what's actually on the shelf.
- Review and update on a defined cycle. The GHS recommends reviewing SDS information every 3 to 5 years, even when no new hazard data has been reported. EU and OSHA regulations also require updates within 90 days of learning significant new information about a chemical's hazards. Without a systematic review process, outdated sheets accumulate and create silent compliance gaps.
- Ensure accessibility meets regulatory expectations. OSHA requires SDS to be readily accessible during every work shift. "Readily accessible" means employees can locate the relevant SDS quickly, without needing to track down a supervisor, search through folders, or navigate a confusing directory. Electronic SDS databases, particularly those integrated with chemical inventory management, meet this standard by allowing search-based access from any workstation, lab terminal, or connected device.
- Connect SDS to training and onboarding. Every employee who works with or near hazardous chemicals must be trained on how to read, understand, and access Safety Data Sheets. This training should be documented and refreshed whenever new chemicals are introduced or when SDS content changes due to reclassification. A training management system that tracks completion and triggers reminders simplifies this for organizations with large or distributed teams.
- Prepare for audits proactively. Regulators expect to see an up-to-date chemical inventory with matching SDS for every hazardous chemical on-site. They also check that employees know where to find SDS documents and how to read them. Organizations that manage SDS digitally, with integrated compliance reporting, can demonstrate audit readiness in minutes rather than scrambling to assemble paper trails.
For a deeper look at what regulators typically ask during chemical safety inspections, see 5 Common Questions From Chemical Regulators (and How to Address Them).
Organizations building or upgrading their chemical inventory program can also explore SciSure's Chemical Inventory Management Playbook for a step-by-step framework covering intake, reconciliation, SDS management, and regulatory reporting.
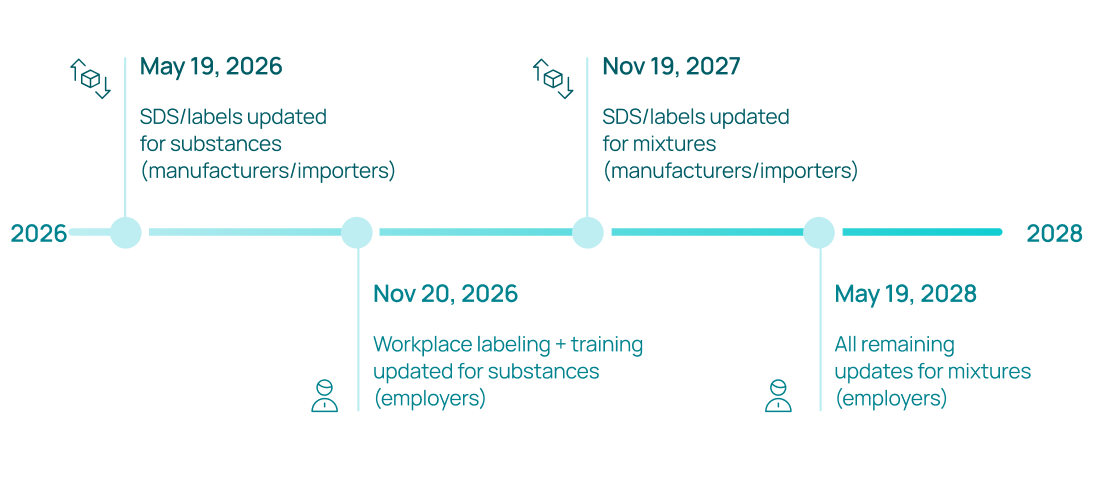
GHS hazard pictograms: visual communication of chemical risks
The GHS uses a set of nine standardized pictograms, each enclosed in a red diamond-shaped border, to visually communicate specific categories of chemical hazards. These pictograms appear on both chemical labels and in Section 2 of every SDS.
Each pictogram represents a distinct hazard type: health hazards (such as carcinogenicity or respiratory sensitization), physical hazards (such as flammability or explosiveness), and environmental hazards (such as aquatic toxicity). The visual standardization means that a worker in any country can recognize the hazard category at a glance, regardless of language.
For lab managers and safety and compliance officers, understanding pictograms is essential for proper chemical storage (ensuring incompatible materials are separated), for selecting appropriate PPE, and for making informed decisions about which chemicals can be used in shared spaces.
A reference guide to all GHS pictograms is available from OSHA's Quick Card on Pictograms.
Conclusion
Safety Data Sheets are one of the most important documents in any chemical safety program. They standardize how hazard information is communicated, protect the people who work with chemicals every day, and form the basis of regulatory compliance under OSHA's Hazard Communication Standard.
With OSHA's revised HCS aligning U.S. standards to GHS Revision 7 and compliance deadlines approaching in 2026 and 2027, now is the time for organizations to review their SDS management processes. That means verifying that every chemical on-site has a current SDS, ensuring employees can access and understand those documents, and connecting SDS records to the broader chemical inventory and safety infrastructure that supports day-to-day operations.
The organizations that treat SDS management as an ongoing operational process, rather than a one-time filing task, are the ones that stay audit-ready, respond faster in emergencies, and build a genuine culture of chemical safety.

Safety Data Sheets (SDS): A Complete Guide to the 16 Sections, GHS, and Compliance
Learn what Safety Data Sheets (SDS) are, what the 16 GHS sections cover, and how to manage SDS compliance across your lab or research organization.
Modern labs generate enormous volumes of experimental data. From high-throughput screening to process analytics, characterization and quality control, today’s research workflows produce increasingly complex datasets. Capturing that data has become easier thanks to digital lab platforms, but turning that data into usable insight is often another story.
But most labs didn’t design their data analysis workflows. They grew organically, tool by tool, file by file. As a result, in many labs, data analysis still sits outside the digital workflow. Protocols may be executed and documented digitally, but once data is generated, scientists frequently export data into spreadsheets, statistical tools, or visualization software to perform analysis and generate reports. The results are then manually transferred back into the lab’s central system.
It’s a workflow most scientists recognize. And while it may feel routine, it introduces unnecessary complexity: slowing down research, creating opportunities for error, and making it harder to maintain a complete and traceable record of how results were generated.
As research organizations scale and experiments become more data-intensive, these disconnected workflows are becoming a major operational bottleneck.
As part of its vision for a truly connected end-to-end digital lab ecosystem, SciSure has partnered with DataChaperone to integrate automated AI-enabled lab data analysis directly into the Scientific Management Platform (SMP). DataChaperone introduces a dedicated analysis layer that most labs are currently missing. The integration enables experimental data captured in SciSure to flow seamlessly into automated analysis workflows, with results returned to the platform without manual data handling.
To understand how this integration helps SciSure customers streamline their lab data analysis and uncover deeper insights from their research data, we spoke with Lars-Eric Feilmich, CEO and co-founder of DataChaperone. In the discussion that follows, Lars explains how automated analysis workflows can eliminate manual data handling, standardize analytical processes, and help SciSure customers close the gap between data capture and scientific insight.
The hidden gap in lab data analysis
In practice, the disconnect between data generation and analysis shows up in how scientists actually work with data day to day. Even in labs that have adopted digital platforms, data analysis often still happens across multiple tools outside the core system.
Scientists export raw instrument outputs into spreadsheets or specialized tools, generate graphs and reports, and then manually re-enter key results into the central system.
“Scientists typically use 3-5 different tools to process raw data to a reported result. It should be one continuous workflow, but in practice it gets broken up across many different systems.”
While this may feel natural for many scientists, it introduces significant operational friction and risk. Every manual handoff between systems increases the likelihood of errors, slows down reporting timelines, and makes it harder to maintain a fully traceable record of how results were generated. That fragmentation comes at a real cost:
“Scientists spend up to 25% of their time on manual data handling. You export results from one system, process them somewhere else, generate graphs, and then bring the results back into the main platform. That back-and-forth handling of data becomes a real bottleneck.”
In regulated environments, the impact can be even greater. Manual steps often require secondary verification to ensure results are correct – adding additional workload and turnaround time for already stretched teams.
“Copy-paste errors might seem minor, but across a large organization they happen regularly. That’s why many regulated environments require a second person to review results, which adds even more time to the process.”
As datasets grow and lab operations scale, this way of working becomes increasingly difficult to sustain.
The value of automating lab data analysis workflows
Recognizing that many of these inefficiencies stem from manual data processing, DataChaperone was created to help labs transform fragmented analysis workflows into structured, standardized, automated processes.
Rather than relying on scientists to manually move data between tools, the platform acts as a dedicated analysis layer between existing lab systems. It automates how raw instrument data is imported, transformed, analyzed, and reported, while incorporating AI-driven logic where analytical decisions are too complex for predefined rules.
“If an analysis workflow can be described in a protocol, we can automate it. Scientists perform the same types of analysis again and again, processing instrument outputs, applying statistical methods, generating graphs, compiling reports. All of that can be standardized and automated with the needed level of flexibility.”
At the core of the platform is a flexible Python-based architecture, enabling DataChaperone to support a wide range of scientific workflows across life sciences and biotech applications. These pipelines can handle everything from data transformation and statistical analysis to visualization and report generation.
In practice, this means machine learning models can be applied to tasks such as pattern recognition, anomaly detection, and classification, allowing complex analytical decisions to be executed consistently and at scale.
“Whether it’s statistics, data transformation, visualization, or more complex workflows, we can build pipelines that automate how those analyses are performed.”
Beyond automation, the platform also introduces greater consistency and traceability to lab data analysis. Each step of the workflow is explicitly defined and executed the same way every time with variable and parameters logged, creating a clear audit trail that tracks how results were generated.
DataChaperone also enables capabilities such as automated data quality checks, standardized reporting, and meta-analysis across datasets once workflows are harmonized, helping organizations extract more value from their experimental data over time.
“Scientists didn’t become scientists to spend their time moving numbers between spreadsheets. When those tasks are automated, they can focus much more on interpreting results and designing better experiments.”
By transforming manual analysis processes into standardized workflows, the platform helps research teams generate consistent, reproducible results while reducing operational overhead.
Closing the loop between experiment and insight
Automating lab data analysis is a powerful step forward, but the real transformation happens when those workflows are embedded directly within the systems where experiments are designed, executed, and recorded.
This is where the partnership between SciSure and DataChaperone drives real impact. For DataChaperone, SciSure stood out as a natural partner because the two platforms address complementary parts of the scientific workflow.
“What immediately stood out to us was how complementary the platforms are. SciSure provides the environment where scientific work is organized and where experimental data is captured. DataChaperone provides the analysis layer that processes that data. When you combine those two capabilities, you can automate the entire journey from experiment to result.”
This digital foundation is critical for making automated analysis possible. Many research organizations are eager to introduce advanced analytical capabilities, but their experimental data is still scattered across spreadsheets, notebooks, and disconnected systems.
“We often speak with labs that are interested in automating their analysis workflows, but they’re still working in paper-based or partially digitized environments. If the data isn’t captured consistently and digitally, it’s very difficult to automate what happens next.”
By integrating DataChaperone directly into the SMP environment, SciSure customers can now move from experiment execution to analytical results within a single connected workflow. Experimental data generated and recorded in SciSure can flow directly into automated analysis pipelines, with results returned to the platform and linked to the original experiment.
Instead of exporting datasets into spreadsheets, running analysis in separate tools, and manually compiling reports, the analytical workflow becomes a structured process embedded within the digital lab environment.
Take flow cytometry gating, for example, a common workflow step that requires subjective interpretation:
“In flow cytometry, scientists decide where to place gating thresholds in order to interpret the data. Those decisions are subjective, and different scientists may approach them slightly differently. When that process is standardized and automated, you remove that subjectivity and make the analysis much more consistent.”
By applying AI-driven classification models, these decisions can be encoded and executed consistently across datasets, removing variability while preserving scientific intent.
The same principle applies across many other lab data analysis workflows, including microscopy image analysis, assay quality control, and statistical validation. By embedding these analytical steps directly into the digital workflow, labs can ensure methods are applied consistently across projects and teams.
For scientists, this means less time spent performing repetitive analysis tasks and more time focused on interpreting results.
“Scientists enjoy working with data, but they don’t necessarily enjoy making repetitive decisions that should really be standardized. When those decisions can be encoded into automated workflows, scientists are freed from routine tasks and can focus on the questions that actually move research forward.”
The integration also removes a common bottleneck for data scientists and bioinformaticians. Analytical pipelines that would typically need to be modified repeatedly for different projects can instead be implemented once and deployed across teams.
“What often happens today is that a data scientist designs an analysis pipeline, and then spends the rest of the year maintaining slightly different versions of it for different projects. With a platform approach, they can focus on building the best analysis methods, while the platform handles how those methods are executed and deployed.”
By embedding automated analysis directly into the digital lab platform, the SciSure–DataChaperone integration helps labs transform what was once a fragmented process into a continuous, traceable scientific workflow.
Learn more about the DataChaperone Marketplace Add-on
Turning structured lab data into scientific insight
Once lab data analysis workflows are automated and embedded within the digital lab ecosystem, labs gain something even more valuable than efficiency: the ability to understand their data at a much broader scale.
When experiments are captured digitally, analyzed through standardized workflows, and stored within a connected platform like the SciSure SMP, datasets no longer exist as isolated outputs from individual experiments. Instead, they become part of a growing body of structured scientific data that can be explored across projects, teams, and time.
This opens the door to to more advanced forms of lab data analysis, where AI and machine learning can be applied to identify patterns, detect anomalies, and generate insights across datasets. One example is quality control trending, where labs monitor how assays and controls behave over time.
“If your data is stored and processed in a consistent way, you can start looking at trends across experiments. For example, you can monitor how an assay or control behaves over time and quickly detect when something begins to drift.”
These capabilities can also be extended using machine learning to automatically flag outliers, identify emerging trends, or detect subtle shifts in assay performance that may not be visible through manual analysis alone.
Without this level of visibility, problems often go unnoticed until experiments begin to fail. Scientists may then have to retrace their steps across multiple datasets and systems to identify the root cause – a process that can take days or even weeks. By contrast, standardized analysis workflows allow research teams to detect issues earlier and maintain tighter control over experimental performance.
As datasets accumulate, this consistency also enables deeper meta-analysis, where patterns can be identified across entire research programs rather than within individual experiments. Over time, these capabilities can significantly change how research organizations operate. As labs grow and experimental throughput increases, manual analytical workflows often become a major bottleneck.
“Lab operations are surprisingly difficult to scale. You can double the size of your lab, but that doesn’t mean you double the output. A lot of the bottlenecks come from manual processes that simply don’t scale well.”
Automated and standardized analytical workflows help remove those constraints. Instead of requiring manual interpretation or repetitive analysis steps for every dataset, analytical pipelines can run consistently and predictably, allowing teams to process larger volumes of experimental data without proportionally increasing workload.
For research leaders, this creates a more scalable operational model, where new experiments, new teams, and new projects can build upon the same analytical infrastructure.
Perhaps most importantly, this structured environment creates the foundation for a deeper form of scientific discovery.
“The knowledge is already in the data. The challenge is that most organizations don’t have a good way to explore it.”
When experimental data, analytical workflows, and results all exist within a connected digital ecosystem, labs can begin to uncover relationships and insights that would otherwise remain hidden within raw datasets.
For SciSure customers, the integration with DataChaperone represents an important step toward that future – one where the digital lab platform not only supports experiments, but continuously helps researchers learn from the data those experiments generate.
Building a more connected digital lab
As experimental datasets grow in size and complexity, the challenge for modern labs is no longer simply generating data, but managing how that data is processed, interpreted, and leveraged.
By integrating DataChaperone’s automated lab data analysis capabilities directly into the SciSure SMP, labs can move beyond fragmented workflows toward a more connected approach to scientific data. Analytical steps such as flow cytometry gating, microscopy image interpretation, and assay quality control can be standardized and automated within the same environment where experiments are designed and recorded.
The impact extends beyond efficiency. When analytical pipelines are consistently applied and results remain linked to their experimental context, labs gain a far clearer picture of how their science is evolving. Teams can monitor assay performance over time, identify emerging trends across experiments, and ensure that analytical methods are applied consistently across projects.
For SciSure customers, the partnership with DataChaperone represents an important step toward a more integrated digital lab, where experimentation, analysis, and insight operate as part of a single, continuous scientific workflow.
When experiments and analysis operate in one system, results are no longer static reports. They become reusable, comparable, and scalable.
Ready to close the loop between experiment and analysis?
Discover how the SciSure Scientific Management Platform and its partner ecosystem help labs automate workflows, standardize data analysis, and turn experimental data into actionable insight. Contact us today.
From ELN to Lab Data Analysis: Closing the Loop Without Breaking Workflows
Discover how a digital lab ecosystem helps research organizations orchestrate data, systems, and workflows to improve efficiency, insight, and scalability.