12 praktische Labor-KPI-Beispiele, mit denen Sie den Erfolg Ihres F&E-Labors messen können
Woran erkennen Sie, ob Ihr Labor erfolgreich ist? Hier sind 10 praxisnahe Labor-KPIs, mit denen Sie den Erfolg konkret messen können.

Download Whitepaper
TL;DR
Labor-KPIs zeigen, ob Ihr F&E-Labor effizient, zuverlässig und sicher arbeitet – und nicht nur, ob es ausgelastet ist.
- 10 Laborkennzahlen aus den Bereichen Forschung, Probenmanagement und Sicherheit.
Zu den von uns behandelten Effizienzkennzahlen gehören die Zykluszeit von Experimenten, die Genehmigungsrate, die Nutzung von Vorlagen, die Durchlaufzeit und Rückverfolgbarkeit von Proben, die Bestandsgenauigkeit, Lieferengpässe, die Geräteauslastung, Wartungsintervalle, die Einhaltung von Schulungsvorgaben, die Umsetzung von Korrekturmaßnahmen sowie die eingesparte Verwaltungszeit.
- Beginnen Sie mit 6 bis 8 KPIs, die auf die Prioritäten Ihres Labors abgestimmt sind.
Ermitteln Sie Ihre eigene Ausgangsbasis, weisen Sie jedem KPI einen Verantwortlichen zu und wägen Sie Geschwindigkeit oder Volumen gegen Qualität und Vollständigkeit ab.
- Digitale Laborplattformen helfen dabei, Erfolge sichtbar zu machen.
SciSure verknüpft ELN-, LIMS-, Inventar-, Geräte- und EHS-Daten und bietet Ihnen so eine verlässliche Datengrundlage, um Engpässe zu identifizieren und Verbesserungen nachzuverfolgen.
- SciSure in der Praxis.
Durchschnittswerte von über 30 Laboren und Organisationen, die SciSure einsetzen, zeigen, dass alltägliche Aufgaben um etwa 88 % schneller erledigt werden, komplexe Berichte um 99 % schneller erstellt werden und der Verwaltungsaufwand um etwa 88 % sinkt.
Ready to see SciSure in action?
No commitment · Free consultation
Ihr Labor kann extrem ausgelastet sein, ohne zwangsläufig gute Leistungen zu erbringen.
Vielleicht laufen Experimente, Proben werden bearbeitet, die Gerätekalender sind bis zum Anschlag gefüllt und Ihre Wissenschaftler sind den ganzen Tag damit beschäftigt, Nachrichten zu beantworten, Datensätze zu aktualisieren und Probleme zu lösen. Von außen betrachtet mag alles produktiv wirken. Doch wenn Sie jemand fragen würde: „Wie läuft es eigentlich im Labor?“ könnten Sie darauf mit Sicherheit antworten?
Sie wissen vielleicht, dass Ihr Team hart arbeitet. Möglicherweise haben Sie auch das allgemeine Gefühl, dass sich die Bestandsverwaltung verbessert, Audits einfacher werden oder die Wissenschaftler weniger Zeit mit Verwaltungsaufgaben verbringen. Schwieriger ist es, diesen Fortschritt klar zu belegen und frühzeitig zu erkennen, wenn sich etwas in die falsche Richtung entwickelt. Genau hier können Key Performance Indicators (KPIs) für Labore helfen.
Sie müssen nicht alles messen. Tatsächlich sollten Sie das wahrscheinlich auch gar nicht. Sie benötigen ein kleines, ausgewogenes Set an Indikatoren, das widerspiegelt, was Erfolg für Ihr Labor bedeutet. Hier sind 10 nützliche Ansätze für den Start.
Was macht einen guten Labor-KPI aus?
Die richtigen Labor-KPIs bieten Ihnen eine praktische Möglichkeit zu beurteilen, ob die Forschung effizient voranschreitet, Ressourcen sinnvoll genutzt werden, Aufzeichnungen zuverlässig sind und Sicherheitsanforderungen eingehalten werden. Zudem schaffen sie eine gemeinsame Sprache, um Fortschritte mit Wissenschaftlern, LabOps, EHS und der Geschäftsführung zu besprechen.
Eine Kennzahl sagt Ihnen, was passiert ist. Ein nützlicher KPI hilft Ihnen zu entscheiden, was als Nächstes zu tun ist.
„Wir haben in diesem Quartal 400 Experimente abgeschlossen“ ist zum Beispiel eine Kennzahl. Für sich genommen sagt sie jedoch nichts darüber aus, ob diese Experimente pünktlich abgeschlossen, einheitlich dokumentiert, zeitnah überprüft oder aufgrund von Fehlern wiederholt werden mussten.
Ein nützlicher KPI sollte:
- Verknüpft sein mit einem Ziel, das für Ihr Labor wichtig ist
- Klar definiert sein damit jeder ihn auf die gleiche Weise berechnet
- Auf Daten basieren die Sie konsistent erfassen können
- Überprüft werden in einem sinnvollen Rhythmus
- Verantwortet werden von jemandem, der bei Veränderungen reagieren kann
Die Zielvorgaben unterscheiden sich je nach Labor. Ein kleines Forschungsteam sollte nicht mit einer Hochdurchsatz-Testanlage verglichen werden, und eine akademische Forschungsgruppe hat andere Prioritäten als ein reguliertes Biopharma-Unternehmen. Ihr eigener Ausgangswert ist meist der hilfreichste Startpunkt. Messen Sie Ihren aktuellen Stand, legen Sie fest, wie eine Verbesserung aussehen würde, und verfolgen Sie die Entwicklung.
KPIs für Forschungsabläufe im Labor
1. Zykluszeit von Experimenten
Die Zykluszeit von Experimenten misst, wie lange ein Arbeitsschritt benötigt, um von einem definierten Startpunkt bis zum Abschluss zu gelangen. Je nach Labor kann dies die Zeitspanne zwischen dem Erstellen und Abschließen eines Experiments, dem Eingang einer Anfrage und der Bereitstellung eines Ergebnisses oder dem Beginn eines Arbeitsablaufs und dem Erreichen eines genehmigten Resultats bedeuten.
Eine einfache Berechnung lautet:
Zykluszeit des Experiments = Datum und Uhrzeit des Abschlusses − Datum und Uhrzeit des Beginns
Verwenden Sie besser den Median statt des Durchschnitts, damit ein ungewöhnlich langes Experiment das Ergebnis nicht verzerrt. Ziel ist es, vermeidbare Wartezeiten zu identifizieren: verzögerte Übergaben, fehlende Materialien, Engpässe bei der Ausrüstung, unklare Genehmigungsverfahren oder administrative Schritte, die den Fortschritt immer wieder unterbrechen.
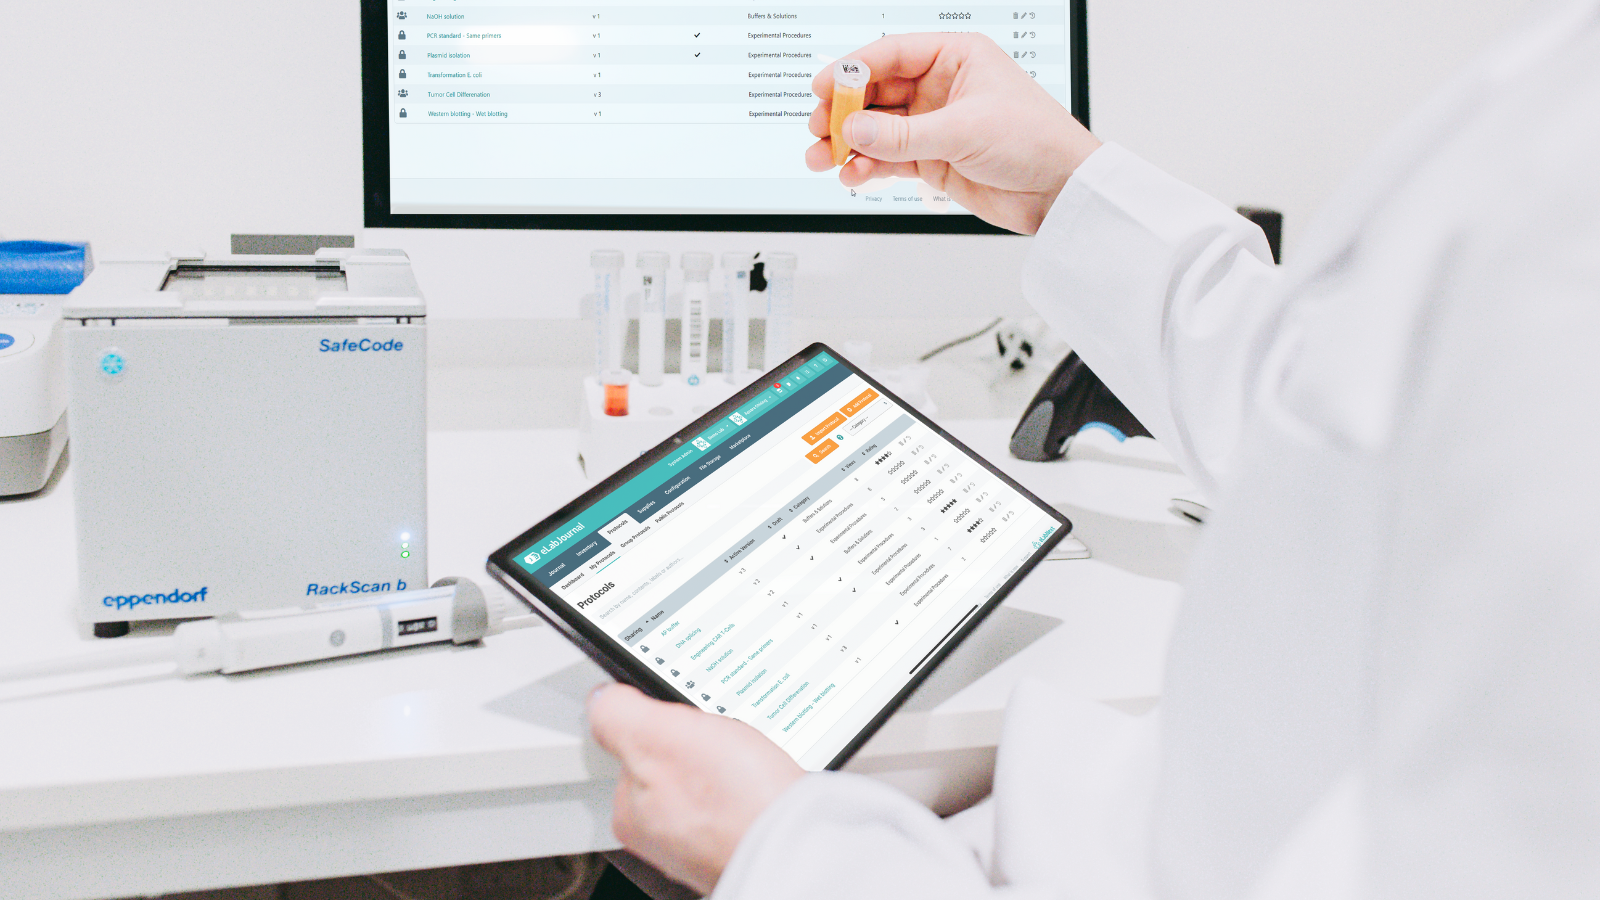
Strukturierte Experimentaufzeichnungen, Statusmeldungen, Zeitstempel und konfigurierbare Arbeitsabläufe im SciSure ELN liefern die grundlegenden Informationen, die Sie benötigen, um Zykluszeiten zu untersuchen und wiederkehrende Verzögerungen aufzudecken.
2. Rate der fristgerechten Überprüfung und Genehmigung
Ein Experiment mag wissenschaftlich abgeschlossen sein, bleibt aber operativ unvollendet, solange es auf Überprüfung, Freigabe oder Klärung wartet. Ihre Rate der fristgerechten Überprüfung zeigt, ob diese letzten Schritte wie geplant vorankommen. Hier ist eine Formel, die Sie verwenden können:
Rate der fristgerechten Überprüfung = Innerhalb des vereinbarten Zeitrahmens abgeschlossene Überprüfungen ÷ Fällige Überprüfungen × 100
Wenn dieser Wert zu sinken beginnt, liegt das Problem möglicherweise nicht an der Produktivität der Wissenschaftler. Es kann sein, dass die Prüfer überlastet sind, die Zuständigkeiten unklar sind oder Unterlagen ohne die erforderlichen Informationen zur Prüfung eingereicht werden.
SciSure Genehmigungs-Workflows, Benachrichtigungen, Zeitstempel, Zeugenunterschriften und Audit-Trails helfen Ihnen dabei, den Status der Unterlagen im Prüfprozess zu verfolgen und zu sehen, welche Schritte noch ausstehen.
3. Übernahme genehmigter Protokolle oder Vorlagen
Vorlagen und kontrollierte Protokolle können die Konsistenz verbessern, aber nur, wenn sie auch genutzt werden. Ein praktischer KPI für die Akzeptanz ist:
Vorlagenakzeptanz = Geeignete Experimente mit der aktuell genehmigten Vorlage ÷ Gesamtzahl der geeigneten Experimente × 100
Eine niedrige Quote kann darauf hindeuten, dass Wissenschaftler die richtige Vorlage nicht finden, die genehmigte Version nicht zum tatsächlichen Arbeitsablauf passt oder Teams inoffizielle Alternativen erstellt haben. Diese Informationen helfen Ihnen, solche Lücken frühzeitig zu erkennen und schneller zu handeln. Manchmal muss die Vorlage selbst vereinfacht oder aktualisiert werden.
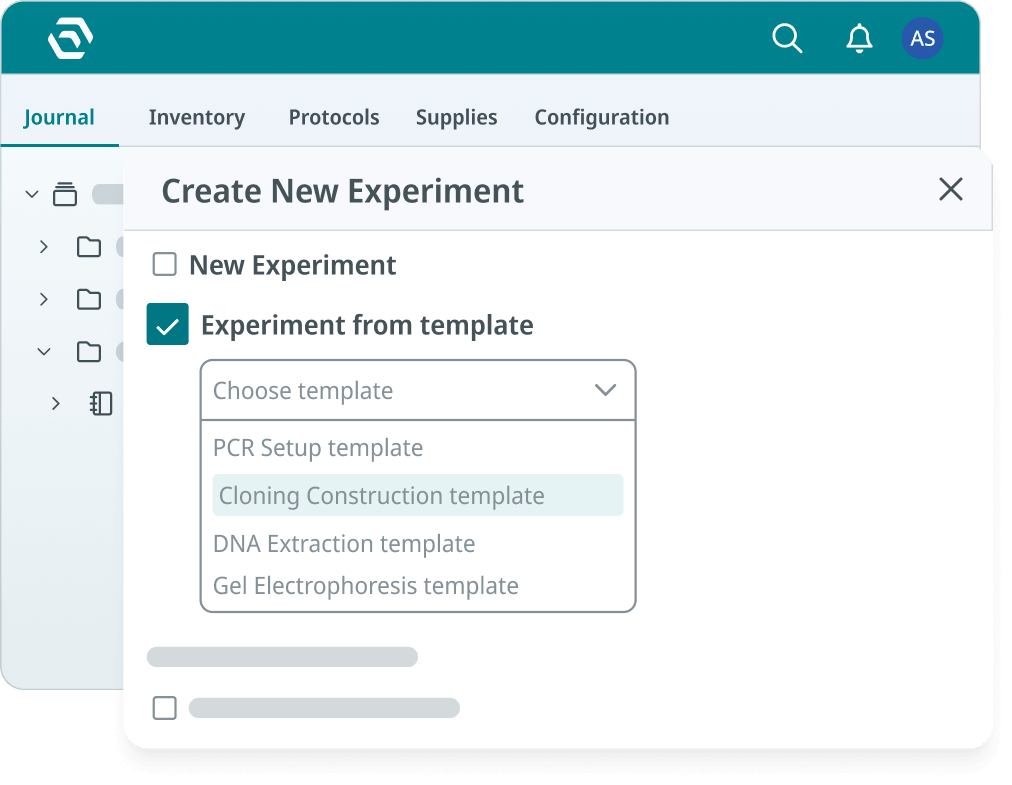
SciSure unterstützt wiederverwendbare Experimentvorlagen, Protokollmanagement, Versionskontrolle und standardisierte Arbeitsabläufe, damit Sie nachvollziehen können, ob genehmigte Methoden tatsächlich in den Arbeitsalltag integriert werden.
KPIs für das Probenmanagement im Labor
4. Durchlaufzeit von Proben
Die Durchlaufzeit von Proben misst, wie lange eine Probe benötigt, um einen definierten Arbeitsablauf zu durchlaufen.
Zuerst müssen Sie festlegen, wann die Zeitmessung beginnt und endet. Für ein Team kann dies von der Probenregistrierung bis zur Analyse reichen. Für ein anderes Team könnte es vom Eingang bis zum genehmigten Ergebnis definiert sein.
Durchlaufzeit von Proben = Workflow-Abschlusszeit − Zeitpunkt der Probenregistrierung oder des Probeneingangs
Die Überwachung der Medianzeit (sowie des Prozentsatzes der innerhalb Ihres erwarteten Zeitrahmens abgeschlossenen Vorgänge) kann Warteschlangen, Verzögerungen bei der Übergabe, Lagerprobleme und überlastete Geräte aufdecken.
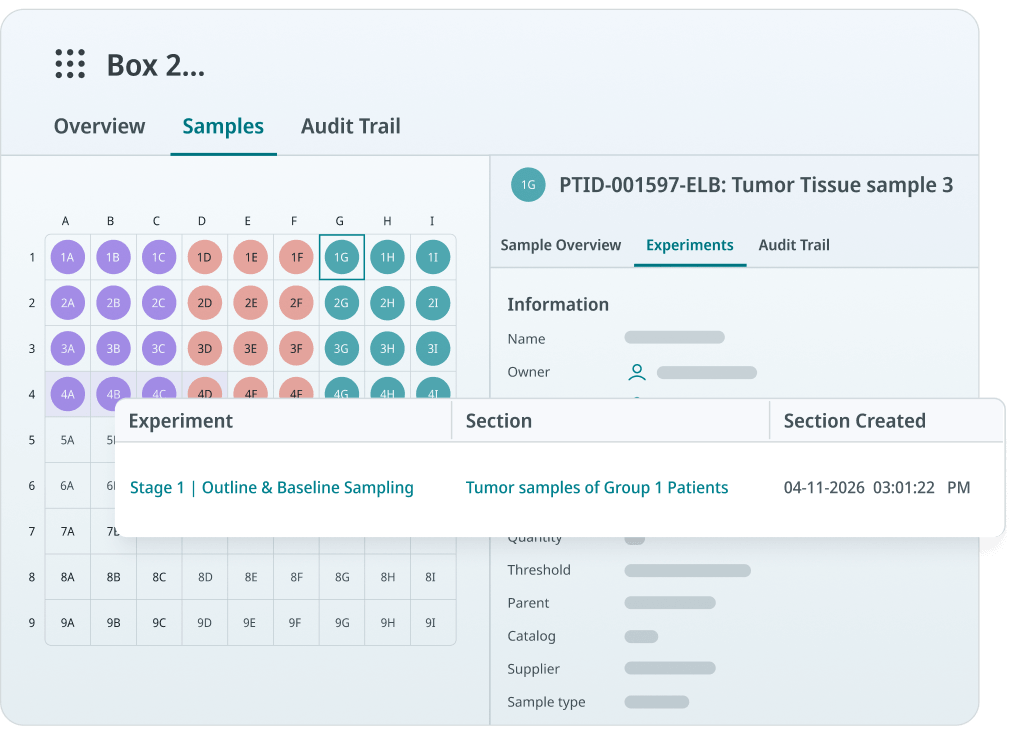
SciSure LIMS bietet strukturierte Probendatensätze, Echtzeit-Statusanzeigen, konfigurierbare Workflowsund Lebenszyklus-Historien. Wenn Ihre Start- und Endpunkte konsistent erfasst werden, können diese Daten für Berichte zur Durchlaufzeit und zur Engpassanalyse genutzt werden.
5. Vollständigkeit der Probenrückverfolgbarkeit
Ein KPI zur Probenrückverfolgbarkeit misst, ob aktive Proben die von Ihrem Labor geforderten Informationen enthalten, wie z. B. Identität, Status, Eigentümer, Standort, Herkunft, Bewegungshistorie und Verknüpfungen zu relevanten Experimenten.
Vollständigkeit der Rückverfolgbarkeit = Proben mit allen erforderlichen Informationen ÷ Geprüfte Proben × 100
Sie können Ausnahmen auch separat nachverfolgen: Proben mit unbekanntem Standort, fehlendem übergeordneten Datensatz, unvollständiger Nachweiskette oder ohne verknüpftes Experiment.
KPIs für Laborbestand und Ressourcen
6. Bestandsgenauigkeit
Die Bestandsgenauigkeit vergleicht den Systembestand mit dem physisch vorhandenen Bestand. Hier ist eine Formel, die Sie verwenden können:
Bestandsgenauigkeit = Datensätze mit physischem Bestand ÷ Geprüfte Datensätze × 100
Sie müssen nicht zwingend jeden Monat das gesamte Labor inventarisieren. Regelmäßige Stichprobeninventuren bei hochwertigen, kritischen oder häufig verwendeten Materialien können frühzeitig darauf hinweisen, dass die Bestandsqualität nachlässt.
Eine mangelhafte Bestandsgenauigkeit führt zu Problemen, die weit über die reine Lagerverwaltung hinausgehen. Wissenschaftler verlieren das Vertrauen in das System, Notfallbestellungen nehmen zu, Experimente verzögern sich und die Erstellung von Compliance-Berichten wird erschwert.
SciSure bietet eine Nachverfolgung auf Behälter- und Artikelebene, Barcode-Workflows, Bestandsaktualisierungen in Echtzeit, durchsuchbare Datensätze sowie Audit-Trails, damit Teams jederzeit einen zuverlässigen Überblick über verfügbare Bestände und deren Lagerort haben. Zum Beispiel: Arctic Therapeutics hat die manuelle Inventur abgeschafft, erhielt Echtzeit-Einblick in die Verfügbarkeit von Lagerbeständen und Reagenzien und sparte mit SciSure wöchentlich etwa zwei Stunden bei der Probenregistrierung und Bestandsverwaltung.
7. Fehlbestandsquote kritischer Artikel
Wenn ein Artikel mit niedriger Priorität ausgeht, ist das vielleicht ärgerlich. Wenn jedoch ein kritisches Reagenz fehlt, kann ein ganzer Arbeitsablauf zum Stillstand kommen. Sie können Fehlbestände als einfache monatliche Zählung oder als Quote erfassen:
Fehlbestandsquote = Kritische Artikel mit mindestens einem Fehlbestand ÷ Anzahl der überwachten kritischen Artikel × 100
Dieser KPI sollte im Verhältnis zum Bestandsverfall betrachtet werden. Wenn Sie sich nur darauf konzentrieren, Fehlbestände zu vermeiden, könnten die Teams dazu neigen, zu viel zu bestellen. Hier sind einige nützliche ergänzende Kennzahlen:
- Wert des abgelaufenen Bestands
- Anzahl der ungenutzt entsorgten Artikel
- Notfallbestellungen pro Monat
- Prozentsatz des Bestands über dem maximal gewünschten Niveau
SciSure unterstützt die Bestandsüberwachung in Echtzeit, Benachrichtigungen bei niedrigem Lagerbestand, anpassbare Inventarkategorien, die Nachverfolgung ausstehender Bestellungen sowie Nutzungsberichte. Diese Funktionen helfen Ihnen dabei, Einkaufsentscheidungen auf Basis des aktuellen Bedarfs statt auf Vermutungen zu treffen.

8. Geräteauslastung
Die Geräteauslastung zeigt an, wie viel der verfügbaren Kapazität eines Instruments genutzt wird. Diese Formel hilft Ihnen bei der Berechnung:
Geräteauslastung = Genutzte Stunden ÷ Verfügbare Stunden × 100
Das Ziel sind nicht automatisch 100 %. Eine sehr hohe Auslastung kann zu Warteschlangen führen und lässt keinen Spielraum für dringende Arbeiten, Wartungen oder unerwarteten Bedarf. Eine sehr niedrige Auslastung kann auf unnötige Kapazitäten, mangelnde Schulungen, schlechte Auffindbarkeit oder ein Gerät hinweisen, das nicht mehr Ihren Anforderungen entspricht.
Der Kontext ist immer entscheidend. Überprüfen Sie daher die Auslastung stets zusammen mit Buchungen, Stornierungen, Ausfallzeiten, experimentellem Bedarf und der Wartungshistorie.
SciSure bietet Buchungskalender für Geräte und detaillierte Nutzungsprotokolle, die zeigen, wer ein Instrument wann und zu welchem Zweck genutzt hat. Dies hilft Ihnen dabei, stark ausgelastete Ressourcen sowie untergenutzte Geräte zu identifizieren.
9. Einhaltung von Wartungs- und Kalibrierungsintervallen
Ein viel genutztes Gerät ist nicht hilfreich, wenn es nicht verfügbar, unzuverlässig oder überfällig für eine Kalibrierung ist. Ein einfacher Labor-KPI hierfür ist:
Wartungs-Compliance = Fristgerecht abgeschlossene Wartungs- und Kalibrierungsaufgaben ÷ Fällige Aufgaben × 100
Möglicherweise möchten Sie auch Folgendes nachverfolgen:
- Ungeplante Ausfallzeiten
- Anzahl überfälliger Kalibrierungen
- Zeit von der Störungsmeldung bis zur Reparatur
- Wiederholte Fehler nach Gerätetyp
Produktivitäts- und Wert-KPIs
10. Für die Wissenschaft gewonnene Verwaltungszeit
Einige der bedeutendsten Verbesserungen lassen sich an der Zeit messen, die Ihre Wissenschaftler und Betriebsteams nicht mehr mit dem Suchen, Korrigieren, Abgleichen oder Wiederherstellen von Informationen verbringen. Sie können die gewonnene Zeit mit einem einfachen Vorher-Nachher-Vergleich berechnen:
Gewonnene Zeit = Zeitaufwand vorher − Zeitaufwand aktuell
Um die umfassenderen Auswirkungen abzuschätzen:
Gesamte gewonnene Zeit = Eingesparte Zeit pro Aufgabe × Anzahl der Aufgabendurchführungen
Dies funktioniert besonders gut bei sich wiederholenden Tätigkeiten wie:
- Suchen von Proben, Chemikalien oder Sicherheitsdatenblättern
- Korrigieren von Bestandsdaten
- Abgleichen eines Lagerorts
- Compliance-Berichte erstellen
- Versuchshistorien rekonstruieren
- Personen identifizieren, die mit einer bestimmten Gefahr arbeiten
- Informationen teamübergreifend zusammentragen
KPIs, die Sie versehentlich in die Irre führen können
Ein KPI kann das Verhalten allein dadurch verändern, dass die Beteiligten wissen, dass er gemessen wird. Deshalb ist eine sorgfältige Auswahl so wichtig.
Achten Sie auf Kennzahlen wie:
- Anzahl der abgeschlossenen Experimente.
Dies kann das reine Volumen belohnen, ohne Komplexität, Qualität oder Wert zu berücksichtigen.
- Anzahl der verarbeiteten Proben.
Ein höherer Durchsatz ist nicht zwangsläufig besser, wenn dadurch auch Fehler, Verzögerungen oder unvollständige Aufzeichnungen zunehmen.
- Niedrige Vorfallzahlen.
Dies kann eher auf eine Untererfassung als auf eine verbesserte Sicherheit hindeuten.
- Maximale Anlagenauslastung.
Wenn Anlagen unter Volllast laufen, bleibt kaum Spielraum für Wartungsarbeiten oder unvorhergesehene Aufgaben.
- Software-Anmeldungen.
Ein Login beweist nicht, dass jemand einen sinnvollen Arbeitsablauf abgeschlossen oder einen Mehrwert erzielt hat.
Kombinieren Sie nach Möglichkeit eine Mengenmetrik mit einer Kennzahl für Qualität, Pünktlichkeit oder Vollständigkeit. Überprüfen Sie beispielsweise den Probendurchsatz zusammen mit der Durchlaufzeit und der Vollständigkeit der Rückverfolgbarkeit.
Wie viele Labor-KPIs sollten Sie verfolgen?
Beginnen Sie mit 6-8 KPIs, die mit den Problemen verknüpft sind, die Ihr Labor vorrangig lösen möchte. Dokumentieren Sie für jeden dieser Punkte:
- Die Frage, die der KPI beantworten soll
- Die genaue Berechnung
- Die Datenquelle
- Ihren aktuellen Ausgangswert
- Ihr ursprüngliches Ziel
- Die für die Überprüfung verantwortliche Person
- Wie häufig die Überprüfung stattfindet
- Welche Maßnahmen zu ergreifen sind, wenn sich das Ergebnis in die falsche Richtung entwickelt
Ein KPI ohne Verantwortlichen oder Reaktionsplan wird schnell zur reinen Dekoration auf dem Dashboard. Überprüfen Sie operative Kennzahlen monatlich oder vierteljährlich, je nachdem, wie schnell sich der zugrunde liegende Prozess ändert. Dringendere Informationen zu Sicherheit oder Compliance erfordern möglicherweise eine wöchentliche oder sogar Echtzeit-Überprüfung.
Auch Ziele sollten sich weiterentwickeln. Sobald ein Prozess stabil ist, benötigen Sie möglicherweise ein ehrgeizigeres Ziel, oder Sie entscheiden, dass der KPI keinen prominenten Platz mehr auf Ihrer Scorecard verdient.
Wie SciSure die Laborleistung sichtbar macht
Viele Labore haben Schwierigkeiten, ihre Leistung zu messen, da die notwendigen Informationen verstreut sind über Papierunterlagen, Tabellenkalkulationen, Posteingänge, Insellösungen und das Gedächtnis der Mitarbeiter. SciSure führt Forschung, Proben, Inventar, Geräte und Sicherheitsabläufe in einer vernetzten Scientific Management Platform zusammen. Das schafft eine solidere Datengrundlage für Sie.
- ELN-Aufzeichnungen können zeigen, wie Experimente dokumentiert, geprüft und genehmigt werden.
- LIMS-Workflows können den Lebenszyklus von Proben abbilden.
- Inventaraufzeichnungen können Lagerbestände, Verbrauch, Standorte und Beschaffungsbedarf aufzeigen.
- Geräteaufzeichnungen können Buchungen, Nutzung, Wartung, Kalibrierung und Reparaturen dokumentieren.
- EHS-Dashboards können Transparenz bei Schulungen, Inspektionen, Vorfällen, Korrekturmaßnahmen und dem Compliance-Status schaffen.
- Berichte, Exporte, APIs und Integrationen hilft Ihnen dabei, bei Bedarf operative Daten mit anderen Geschäfts- oder Finanzinformationen zu verknüpfen.
Nicht jede Definition von Erfolg lässt sich direkt aus einer Software ableiten. Wissenschaftliche Qualität, das Vertrauen der Mitarbeiter, Kosten pro Experiment, Fortschritte im Portfolio und geschäftliche Auswirkungen erfordern unter Umständen zusätzliche qualitative, finanzielle oder projektbezogene Daten.
Wenn Ihre operativen Aufzeichnungen jedoch vernetzt und zuverlässig sind, müssen Sie nicht mehr jede Antwort von Grund auf neu erarbeiten. Sie erhalten einen klareren Überblick darüber, was funktioniert, wo Reibungsverluste entstehen und wo Ihre nächste Optimierung die größte Wirkung erzielen wird.
Fortschritte sichtbar machen
Der Erfolg Ihres Labors ist das Zusammenspiel aus zuverlässigen Forschungsaufzeichnungen, rückverfolgbaren Proben, verfügbaren Materialien, einsatzbereiten Geräten, reaktionsschnellen Sicherheitsprozessen und Wissenschaftlern, die sich voll auf ihre Arbeit konzentrieren können. Die richtigen KPIs machen diese Bedingungen sichtbar.
Beginnen Sie mit den Fragen, die Ihr Team ohnehin schon stellt. Wo warten wir? Was müssen wir immer wieder reparieren? Welche Risiken sind überfällig? Wo verlieren Wissenschaftler Zeit? Wählen Sie dann die kleinste Menge an Kennzahlen aus, die Ihnen hilft, diese Fragen zu beantworten und Maßnahmen zu ergreifen.
Wenn Sie sehen können, wie Ihr Labor arbeitet, wird Verbesserung viel weniger abstrakt und Erfolg zu etwas, das Sie belegen können, anstatt es nur zu vermuten.
Bereit für einen klareren Blick auf Ihr Labor?
SciSure verknüpft Forschungs-, Laborbetriebs- und Sicherheitsdaten, damit Ihr Team Engpässe erkennen, Fortschritte verfolgen und Entscheidungen fundierter treffen kann.
Sprechen Sie mit einem SciSure-Experten um herauszufinden, wie Ihre bestehenden Arbeitsabläufe eine praxisorientierte Scorecard für die Laborleistung unterstützen können.

Read more of our blogs about modern lab management
Discover the latest in lab operations, from sample management to AI innovations, designed to enhance efficiency and drive scientific breakthroughs.