Reading the Signals: What Your Usage Data Says About the Scientist Experience
Learn how usage data reveals hidden friction in digital lab workflows—and how usage insights help improve the Scientist Experience without slowing science.
Download Whitepaper
Ready to see SciSure in action?
No commitment · Free consultation
From the outside, a lab’s digital environment can look efficient. Workflows are documented. Systems are implemented. Dashboards are populated. On paper, everything appears to be working. But the Scientist Experience (SX) is not defined by what systems can do. It’s defined by how they behave in the hands of scientists, day after day, under real working conditions.
The SX is the lived experience of moving through digital tools while trying to do science. It’s how naturally a system fits into experimental flow. Whether information appears at the right moment. Whether context carries forward without effort. And whether scientists can stay focused on their work—or are constantly pulled out of it by friction they’re expected to manage themselves.
When the experience is poor, the impact is rarely dramatic. Instead, it shows up in small ways: repeated clicks, unnecessary navigation, re-entering information, pausing to check which version is correct, or stepping outside the system entirely to keep moving. Individually, these moments seem trivial. Collectively, they shape how work actually gets done and if the science is reproducible.
Usage data offers a way to see these moments clearly. Not as a scorecard for adoption, but as a set of signals that reveal where digital systems align with scientific work—and where they quietly work against it. In this article, we’ll explore what those signals reveal about the Scientist Experience, how small frictions compound over time, and how labs can use responsible usage insights to refine systems so they better support the way science actually happens.
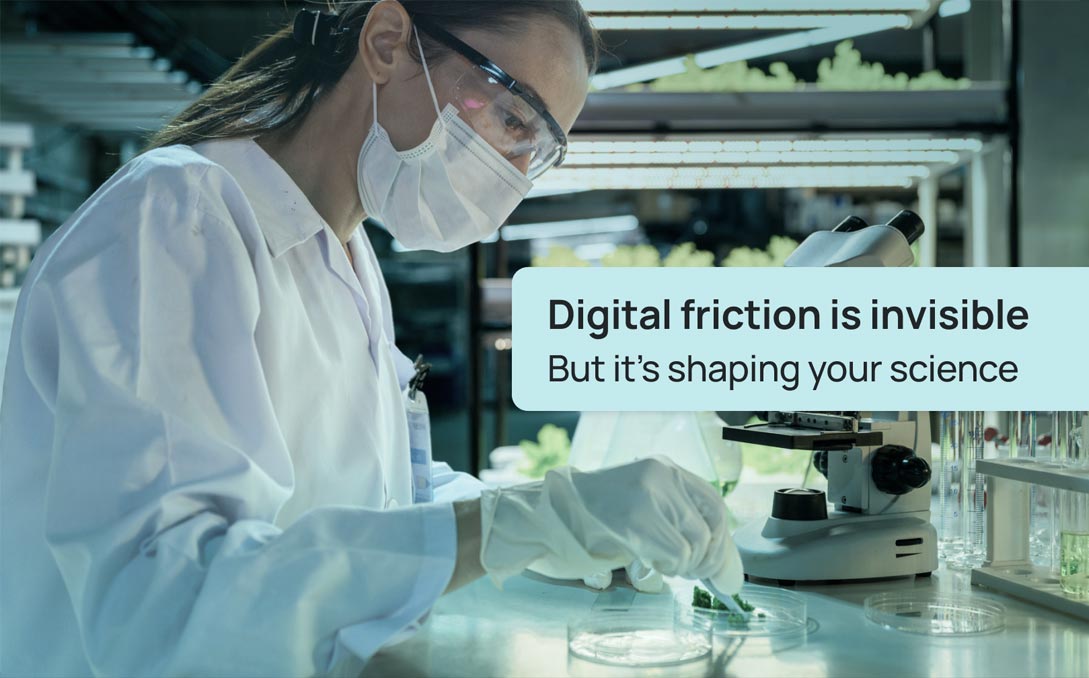
Friction doesn’t announce itself — it accumulates
Most digital friction in labs doesn’t appear as a single broken step. It emerges as a pattern of small interruptions spread across the day. Moments where momentum slows. Where focus breaks. Where scientists adapt around the system rather than working with it.
Common sources of friction include:
- Fragmented workflows, where scientists are forced to jump between systems to complete what should be a single task
- Disconnected metadata, requiring manual reconstruction of context that the system should already know
- Version uncertainty, where multiple SOPs or protocols coexist without clarity
- Overbuilt templates, which require interpretation instead of enabling execution
- Administrative tasks—inventory checks, logging, safety reviews—that sit outside experimental flow
- Workarounds, created when systems don’t support how work actually happens
None of these issues are catastrophic on their own. But over time, they compound. Cognitive load increases. Variability creeps in. Informal processes replace formal ones. And the gap between “the system” and “the work” widens.
Importantly, this isn’t a scientist problem. It’s a systems problem. And it’s one that’s often invisible without the right lens.
What usage data really reveals about the Scientist Experience
Usage data captures behavior, not intention. It shows what scientists actually do to move work forward—where they pause, repeat steps, retrace their path, or disengage altogether. Usage data from laboratory information management system software and connected lab tools can reveal where scientists slow down, skip steps, or work around the system. In that sense, it offers a far more honest view of the Scientist Experience than surveys, interviews, or design assumptions ever could.
Crucially, these behaviors are rarely conscious choices. Scientists aren’t deliberately resisting tools or ignoring features. They’re responding to the system in front of them, adapting in small ways to keep work moving. Usage data reveals those adaptations—and, in doing so, exposes where systems place friction back onto the user.
When analyzed responsibly and in context, patterns begin to emerge that point to deeper misalignment:
- Underused features often signal that tools are poorly timed, hard to discover, or misaligned with real scientific needs—not that scientists lack training or motivation.
- Repeated manual actions indicate places where automation falls short or configurations don’t reflect how work is actually performed, forcing scientists to carry unnecessary operational load.
- Navigation loops reveal moments where the system withholds context, requiring users to hunt for information instead of progressing smoothly through a task.
- Idle time and abandoned steps highlight workflows that are too long, too fragmented, or missing critical guidance, breaking momentum and increasing cognitive effort.
- Wide variation between users shows where processes are unclear or inconsistently enforced, allowing informal practices to replace shared, reliable workflows.
Taken together, these signals do more than identify usability issues. They reveal how the digital environment shapes behavior—where it supports focus and consistency, and where it quietly encourages deviation, duplication, or workaround culture.
This is the real value of usage data. It doesn’t tell labs what scientists should be doing. It shows what they are doing to succeed despite friction—and gives organizations the insight they need to redesign systems so that effort is spent on science, not on managing the tools meant to support it.
From visibility to improvement: using signals to refine systems
Once patterns are visible, the question shifts from what’s happening to what the system is asking scientists to absorb. This is where usage data moves from observation to action.
Used well, usage data becomes a design and decision-making input. It helps teams see where effort is being redirected away from science and into compensating for the digital environment. Each signal represents a choice point: leave the friction in place, or redesign the system so that work flows more naturally.
This reframes improvement entirely. Instead of attempting to correct behavior through training or enforcement, organizations can focus on removing the conditions that made those behaviors necessary in the first place. The aim is not stricter adherence, but better alignment.
In practice, this means using usage insights to guide where and how systems evolve:
- Deciding which steps genuinely need structure, and which should be simplified or removed
- Determining where guidance should be embedded directly into workflows rather than documented elsewhere
- Clarifying where consistency protects quality, and where flexibility supports scientific judgment
- Identifying changes that reduce mental bookkeeping, even if they don’t dramatically reduce task duration
Over time, these choices reshape the experience of using the system. Work becomes more predictable without becoming rigid. Scientists spend less effort managing process and more effort advancing experiments. Deviations decrease not because they’re restricted, but because they’re no longer necessary. The science behind this approach is well documented and reproducible.
The end goal isn’t optimization for its own sake. It’s a digital environment that adapts as work evolves—one that absorbs complexity at the system level so scientists don’t have to. When usage data is used this way, it supports continuous alignment between tools and real scientific practice, without slowing science down.
How SciSure enables continuous SX alignment
Aligning digital systems with real scientific work is not a one-time exercise. As experiments evolve, teams change, and new requirements emerge, the Scientist Experience shifts with them. Sustaining a strong SX requires systems that empower users to observe, learn, and adapt—without introducing friction of their own.
SciSure for Research is designed around this principle. Its unified architecture brings ELN, LIMS, experiment documentation, sample and inventory management and integrations into one connected system, so every piece of lab activity forms part of a coherent digital record.
This connection matters for insight. When systems are fragmented, understanding how work behaves in context is nearly impossible: data lives in separate silos, and patterns get lost in translation. A unified platform gives labs a single source of truth, where real-time analytics and usage patterns reflect complete workflows rather than disconnected fragments. This connected digital environment creates a reliable foundation for improvement without adding steps, oversight burden, or cognitive load for users.
Within SciSure’s connected digital research platform, usage data becomes more actionable:
- Real-time analytics help teams see where certain steps take longer than expected or where workflows are more complex than they should be, enabling evidence-based refinement rather than guesswork.
- When context travels with the work—connecting samples, protocols, safety statuses, and outcomes—teams can understand why certain patterns emerge, not just that they do.
- With core lab functions connected in one platform, improvements made in one area carry through to related workflows, reducing cognitive load and manual redundancy.
This unified context also makes change safer. Workflows can be adapted, connected tools updated, and automation broadened without disrupting ongoing research. Incremental refinements build on a shared understanding of how work gets done, preserving continuity even as systems evolve.
In this way, SciSure supports more than visibility. It enables a continuous alignment between how science is practiced and how systems support it—closing feedback loops around real work patterns rather than theoretical workflows.
The result is a digital environment where scientists spend less time managing process and more time advancing discovery.
Designing systems that work the way science does
The strongest digital systems don’t demand constant attention from scientists—they earn trust by staying out of the way.
Usage data makes it possible to see where that trust breaks down, and where systems quietly ask scientists to compensate. Used responsibly, those signals become a guide for better design: removing friction, reinforcing good practice, and allowing workflows to evolve alongside the work itself.
When systems adapt to science—not the other way around—the Scientist Experience improves naturally, and progress accelerates without added resistance.
Ready to understand how your digital systems behave under real conditions?
Book a demo to see how connected workflows help labs turn usage signals into meaningful improvement.

Read more of our blogs about modern lab management
Discover the latest in lab operations, from sample management to AI innovations, designed to enhance efficiency and drive scientific breakthroughs.